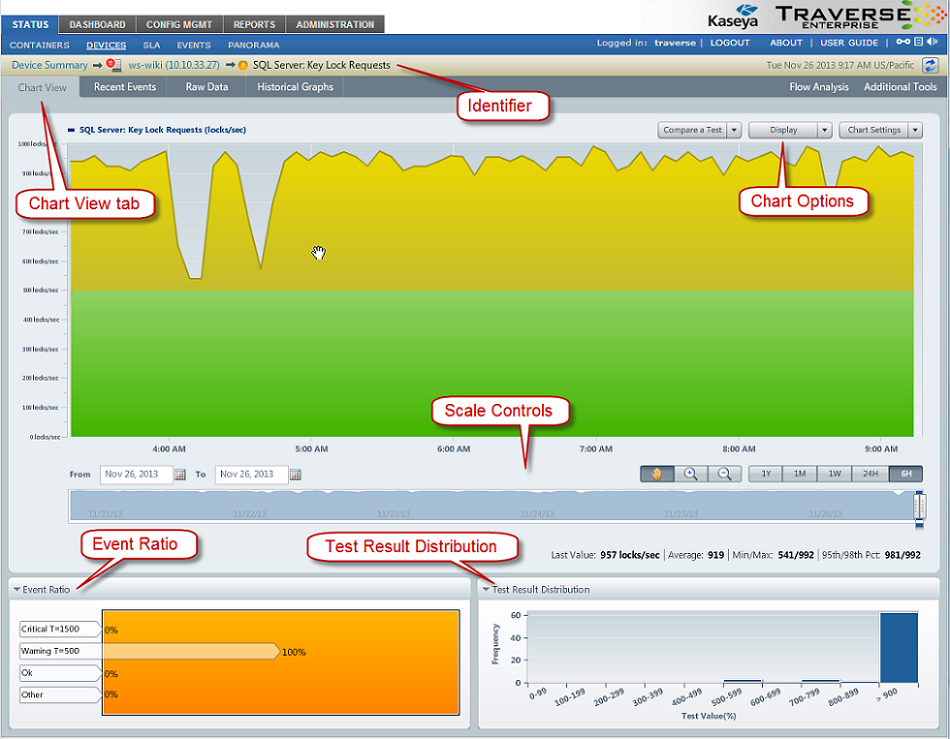
The Chart tab displays the status and raw data history of the test graphically using several different panels. The main chart indicates OK, WARNING and CRITICAL thresholds in layers of green, yellow and red. Note the following objects on this view tab:
Identifier - Identifies the name of the device and the name of the test.
Chart tab - The default tab of the Test <name> Status View. Provides a graphical view of the status and most recent raw data returned by the test.
Chart Options
Compare a Test - Displays a comparison chart of the current test with one or more tests from another device.
Display - Adds chart indicators for the minimum, maximum, trend line, and 95th percentile. The average value is selected by default.
Chart Settings - Sets the scales to linear or logarithmic. Also sets the refresh rate for the chart.
Scale Controls
Move, Zoom in, and Zoom Out - Click and drag the chart right or left. Use the zoom in and zoom out buttons to scale the size of the chart.
Date/Time Range Settings
Most Recent Fixed Time Periods - Use the fixed time period buttons to set the "most recent" date and time range for the chart.
Custom Date Range - Use the calendar controls or slider control to the select a custom start date and end date for the chart.
Event Ratio - Shows the ratio returned data has been OK, WARNING, CRITICAL, or OTHER, for the selected date/time range.
Test Result Distribution - Shows the frequency test data occurred in a distribution of test value ranges.