![]()
![]()
![]()
|
|
|
|
Performance graphs generated in the Reports > Custom > Historical Performance report have a ![]() icon that you can click to open the graph in a separate browser window.
icon that you can click to open the graph in a separate browser window.
In this new window, click (on an area on the graph) and hold the left mouse button to the highlight of the graph that you want to magnify.
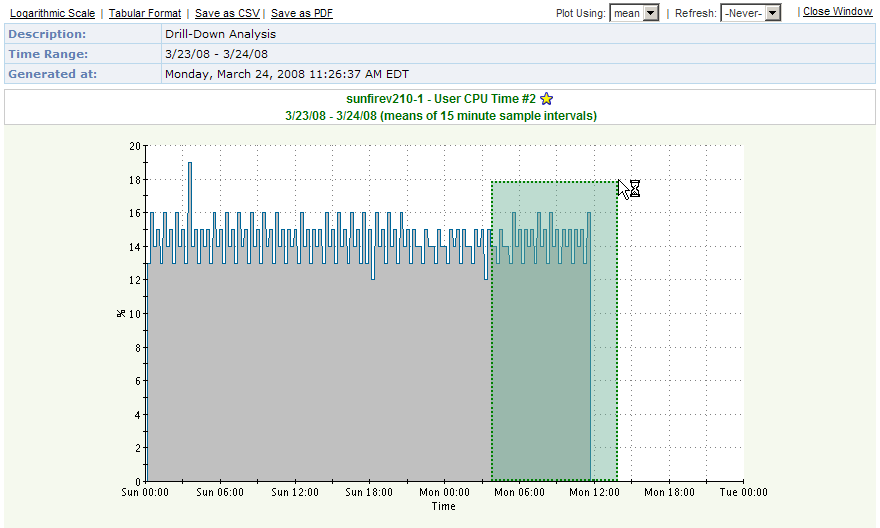
When you release the mouse button, the selected area displays. Click the Zoom Out link to return to the previous magnification level.
Alternatively, click Tabular Format to display the graph in table format, or click Logarithmic Scale to display the graph logarithmically. You can also export the graph data to a .csv file by clicking Save as CSV.