![]()
![]()
![]()
|
|
|
|
The components of Traverse, including DGEs and DGE extensions, can be easily monitored and their status checked from the Superuser > Health screen.
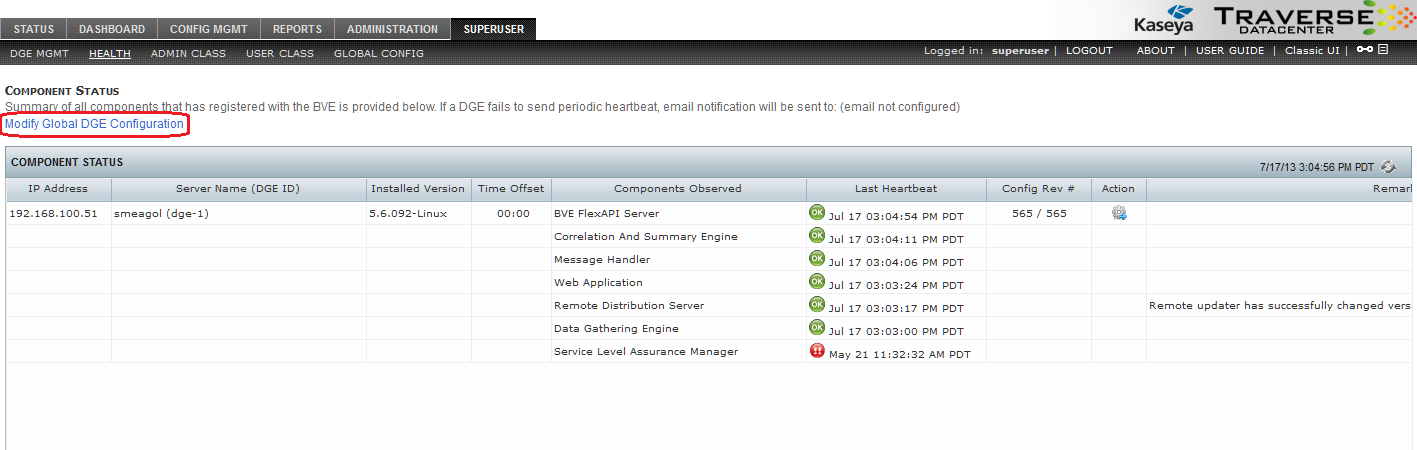
This page presents you with a list of the running components observed, their state, and the last date/time that the component provided a heartbeat. Additionally, the configuration revision of the local configuration files, and any remarks are presented. In the action column, you may choose to remove the server and all of its components from the health screen, or to reload the configuration files.
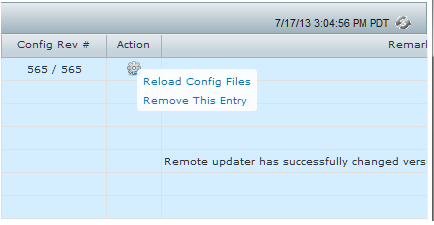
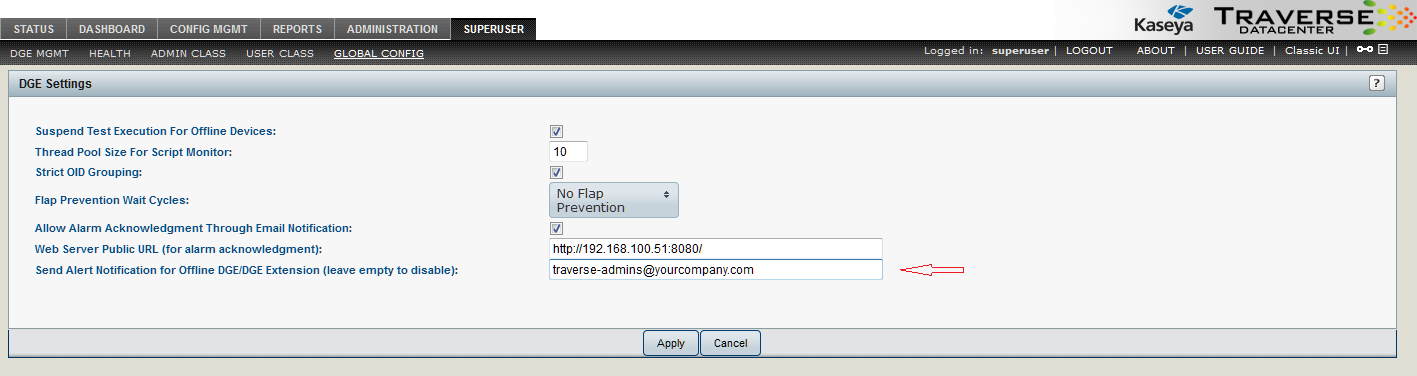
Removal of the entry clears all components for the server. Once a server has checked back in, the entry reappears, with the most current status on the health screen. From this screen, you may also setup notifications for DGE or DGE extensions that have stopped reporting in. First, choose the Modify Global DGE Configuration link, from the Component Status (or Health) page.
On this page, you can specify an email recipient to send alerts to in the event of a DGE or DGE extension going offline. This field is empty by default, thus sending no messages in the event of a downed DGE or DGE extension.
In addition to the user interface elements provided for monitoring the DGE, the DGE component itself keeps track of different types of monitors that are running, the number of objects processed and the number of items in various queues waiting to be processed.
Monitoring the Status of the DGE Using Telnet
You can telnet into the DGE component. Use port 7655, the default, or the port you have configured on the server.
% telnet my_dge 7655
Trying n.n.n.n...open
Connected to my_dge
Escape character is '^]'.
Traverse device monitor
password: *****
<<welcome>>
Once logged in, you can use the status command to view the health of each monitor, as well as the number of times they have performed a health check of configured elements.
controller> status
<<begin>>
Monitor[sql] - com.fidelia.emerald.monitor.SqlQueryMonitor
Number of passes: 0
Work Units processed: 0
Thread Status: alive
Monitor[radius] - com.fidelia.emerald.monitor.RadiusMonitor
Number of passes: 993
Work Units processed: 993
Thread Status: alive
Monitor[ldap] - com.fidelia.emerald.monitor.LdapMonitor
Number of passes: 0
Work Units processed: 0
Thread Status: alive
[additional status lines removed]
<<end>>
On a healthy DGE, Thread Status for all the monitors should indicate alive and the number of passes and number of work units processed should be increasing, provided there are one or more tests of that particular type configured (and not suspended) in the system.
The DGE status server also provides important information regarding capacity planning. The Schedule Queue section of the status command output indicates how many tests are waiting to be performed:
MonitorServer
Schedule Queue [Monitor[sql]] Size: 0
Schedule Queue [Monitor[ldap]] Size: 0
Schedule Queue [Monitor[radius]] Size: 0
Schedule Queue [Monitor[port]] Size: 0
Schedule Queue [Monitor[ntp]] Size: 0
Schedule Queue [Monitor[poet]] Size: 0
Schedule Queue [Monitor[ping]] Size: 0
Schedule Queue [Monitor[snmp]] Size: 2
Schedule Queue [Monitor[dns]] Size: 0
Schedule Queue [Monitor[external]] Size: 0
Result Queue Size: 0
Aggregation Writer Queue Size: 0
Result Writer Queue Size: 0
Event Writer Queue Size: 0
In the event of a network outage, the size of different queues may grow to a large number depending on the network topology and reachability of each device. Once the outage has been resolved, the queues should start to decrease. However, if under normal operating conditions the queue continues to grow, it would indicate that new tests are being added to the queue before existing tests can be performed, and your DGE capacity has been exceeded. At this point you need to one of the following:
Once completed, you can use the quit command to log out of the DGE status server.
controller> quit
<<bye>>
Connection closed by foreign host.