You can access the Network Flow Analysis console from a device Test Summary page or from a Test Details page. Each chart in the network flow analysis console has a title bar that states which device(s) (and optionally, which application) are being examined, as well as their roles.
Navigate to Status > Devices and click on a device name.
On the Test Summary page, open the Run Reports drop-down menu and click on Flow Analysis.
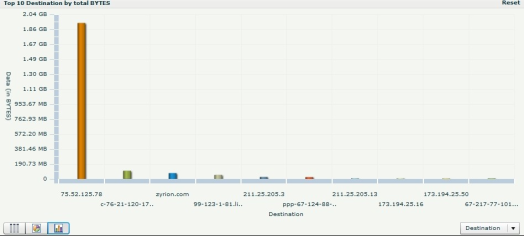
By default, network flow data for the past 24 hours is analyzed to determine the top 10 destinations communicating with the selected device (source), and the results are presented in bar chart format.
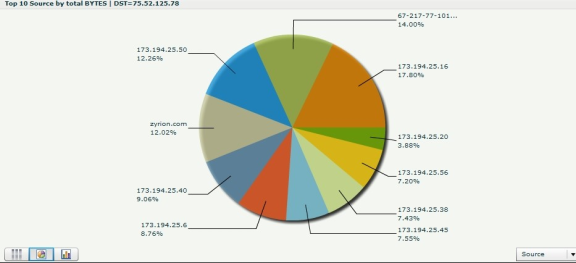
Click on the results for an IP address on the Destination chart to display the top 10 applications for that destination of that source alongside in pie chart format.
Click on the results for an application on the Applications chart to display historical data for network traffic for that application for the selected destination-source pair.
Normally data is displayed for a single source or destination device, but you can click Reset in the upper right corner of the first chart in the network flow analysis console to expand the scope of data to the entire network, providing a network-wide view of the top-N sources, destinations, or applications.
Click through as described above to get detailed device data.
Each network flow analysis chart can be displayed as a table, a pie chart, or a bar chart. Click on the corresponding button in the lower left corner of the chart to change how the data is displayed.
You can change the network flow analysis workflow by looking at a device first from any of the three different roles: source, destination, or application. Choose the role from the drop-down menu in the lower right corner of the chart.
Use the options in the menu bar at the top of the network flow analysis console to customize the data shown:
The Protocol drop-down menu lets you choose whether to show just tcp or udp traffic, or all traffic.
You can specify the Start Time and End Time to see network flow data for a particular time period.
The Metric drop-down menu lets you choose whether to show data in bytes or packets.
The Top field lets you choose how many clients or servers to show.
Note: You must click Apply to show the new data after making any changes to these options.