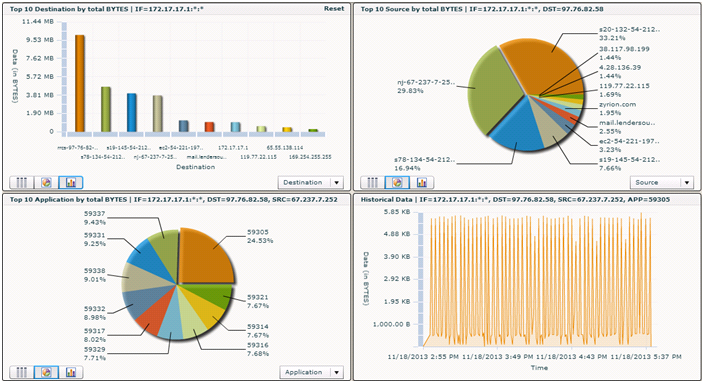
By default, the console shows network flow data for the past 24 hours.
The first chart displays the top 10 destinations communicating with the selected device (source). The results are presented in bar chart format.
If you click a destination IP address on the Destination chart, the top 10 sources are displayed alongside in a pie chart.
If you click a source on the Source chart, the top 10 applications for that source are displayed in a pie chart.
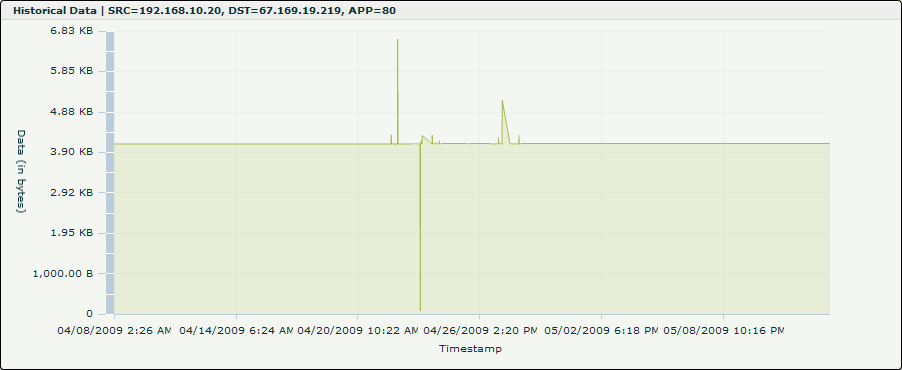
If you click an application on the Application chart, historical data is displayed for network traffic for that application for the selected destination-source pair.
Router Netflow Statistics
If you click a chart object while viewing a router, the Netflow Analysis Console displays all netflow statistics traversing the router.