|
|
|
|
Visual feedback
When a connection has been created and linked to a Bandwidth monitor, Network Monitor is able to present visual feedback on the current bandwidth utilization for the connection. Distributed Edition users should note that this feature is also available for monitors on gateways.
The visual feedback consists of two arrows representing the inbound and outbound traffic on the connection. The inbound traffic arrow pointing towards the object and the outbound traffic arrow pointing away from the object.
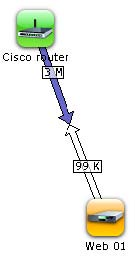
Bandwidth utilization visual feedback
The thickness, and color, of the arrows indicates the utilization level. The thicker the arrow is, the greater the bandwidth utilization.
The color of the arrows also give an indication to the utilization level. The arrow color is on a scale going from white (lowest utilization), blue, green, orange, up to red (highest utilization).
The amount of traffic going in each direction is also visible directly on the connection itself, expressed in Kbps/Mbps/Gbps as appropriate.
Topic 9168: Send Feedback. Download a PDF of this online book from the first topic in the table of contents. Print this topic.