Report graphs display a chart of recorded monitor data over a specific period. Each graph can contain data from up to 8 individual monitors. Every monitor is coded with a specific color. The color is specified in the relevant Style template.
Report chart properties
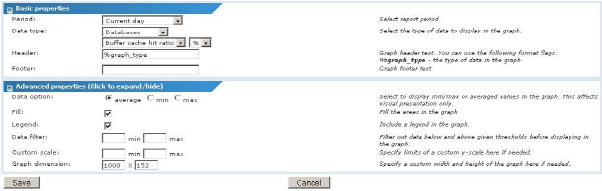
Basic properties
Period - This setting is only available when editing graphs in a Customized report. Select the period to report the data.
Data type - Select the type of data to include in the report, as well as the desired unit.
Header - Specify header text for the graph. Optionally include the following parameter in the header.
%graph_type - the type of data in the graph.
Footer - Specify footer text for the graph.
Advanced properties
Data option -This setting defines how Network Monitor should present the data when there are more recorded samples for a given position in time. Defaults graphing an average of those values. This setting affects visual presentation only.
Fill - If the graph should be filled, select this option. If more than one monitor is graphed in the same chart, Network Monitor ignores this setting.
Legend - Include a legend after the graph. This contains a reference to all monitors included in the graph, as well as their extreme values over the period.
Data filter - Optionally specify a min and max range for visible data. Data outside of the given range is ignored.
Custom scale - Optionally limit the graph to a certain range in the Y-axis. Normally, this is controlled automatically by the type of the data.
Graph dimension - Specify the dimension of the graph image. The default value is 1000 x 152 pixels.