Once assets are assigned different types of monitors, run a Quick report to compare data from different types of monitors. When multiple assets are selected, data for the same monitor type is grouped together on the same graph.
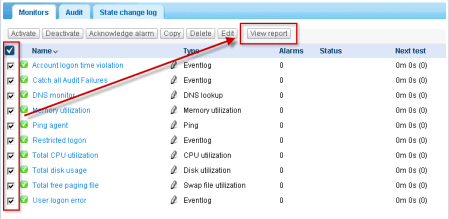
The fastest way to configure a quick report is from the list view of a Monitors tab of a single asset. Select all the monitors for that asset on the Monitors tab. Click the View report button at the top of the monitor list.

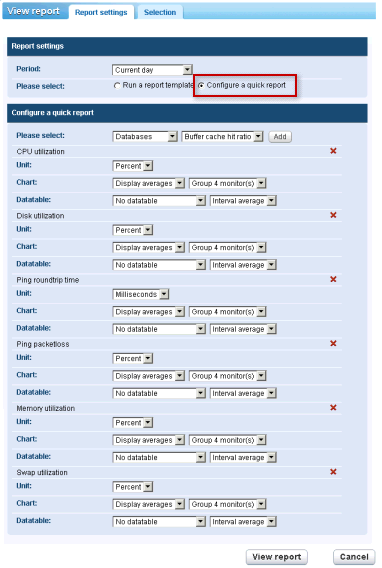
Click the Configure a quick report option. The Report settings tab lists a series of configuration sections, one or more for each type of monitor you selected earlier.

Click the View report button at the bottom of the page. Monitor data displays in chart format for each of the sections configured on the Report settings tab.
Note: To display the report in a new tab or window, set the Network Monitor > User > My settings > Interface options tab > View reports drop-down list to Open reports in a new window.
Using this same page you can:
Note: You can also select the Run a report template option to run a report with a pre-defined layout for the assets you selected.