![]()
![]()
![]()
|
|
|
|
Network Monitor can display the bandwidth utilization of specified network interfaces directly on the network maps, in real time.This feature is also available for monitors on gateways. A connection has to be specified between two nodes on a network map, then linked to a Bandwidth monitor.
The visual feedback consists of two arrows representing the inbound and outbound traffic on the connection. The inbound traffic arrow pointing towards the asset and the outbound traffic arrow pointing away from the asset.
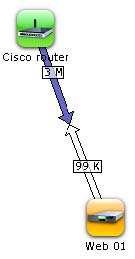
Bandwidth utilization visual feedback
The thickness, and color, of the arrows indicates the utilization level. The thicker the arrow is, the greater the bandwidth utilization.
The color of the arrows also give an indication to the utilization level. The arrow color is on a scale going from white (lowest utilization), blue, green, orange, up to red (highest utilization).
The amount of traffic going in each direction is also visible directly on the connection itself, expressed in Kbps/Mbps/Gbps as appropriate.