![]()
![]()
![]()
|
|
|
|
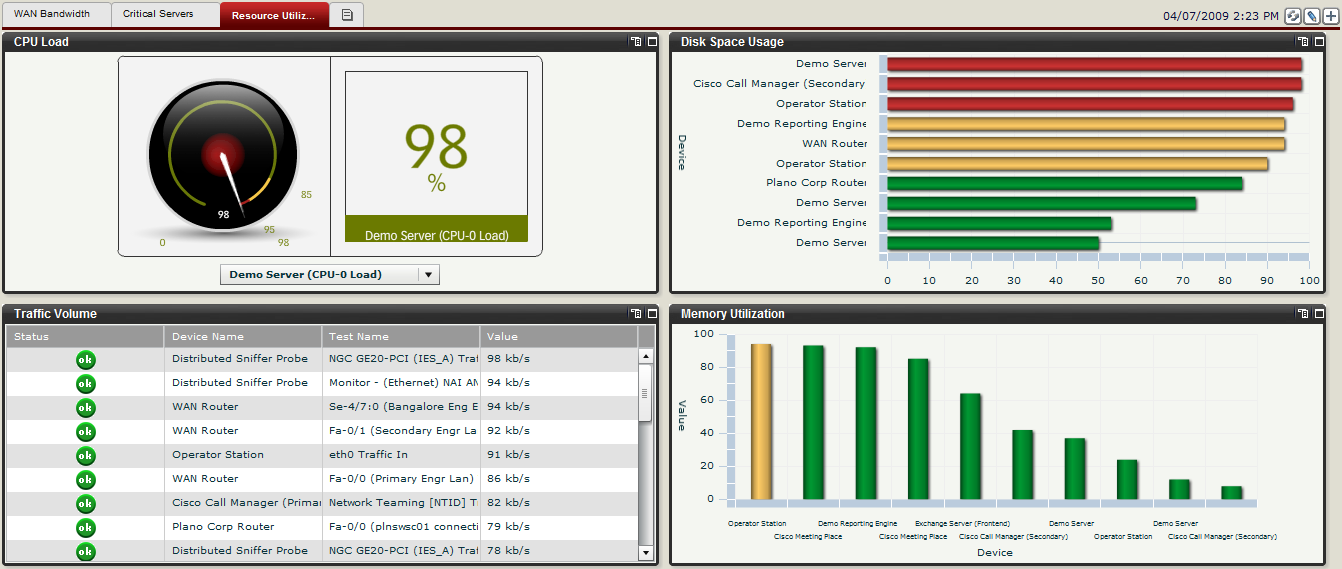
The following figure shows an example dashboard with components that track four aspects of resource utilization: server CPU load, traffic volume, top disk space users, and top memory users.
Resource Utilization Dashboard
The following figures show close-up views of each of the dashboard components in the above dashboard.
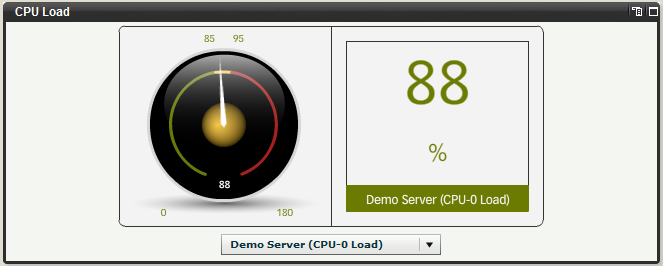
CPU Load Dashboard Component
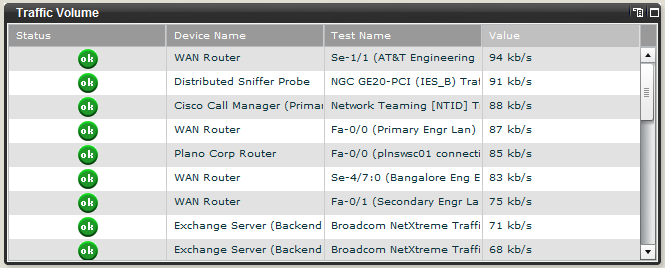
Traffic Volume Dashboard Component
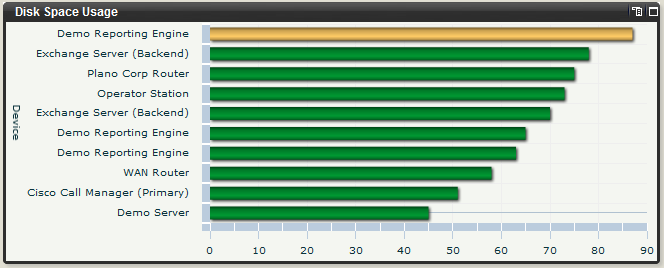
Disk Space Usage Dashboard Component
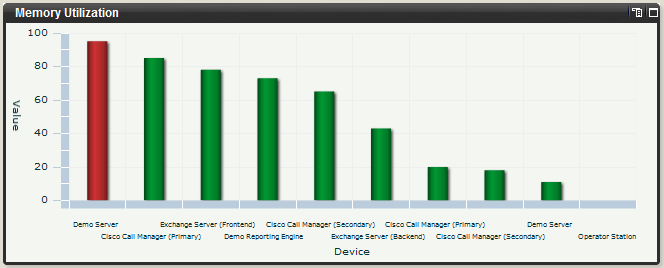
Memory Utilization Dashboard Component