![]()
![]()
![]()
|
|
|
|
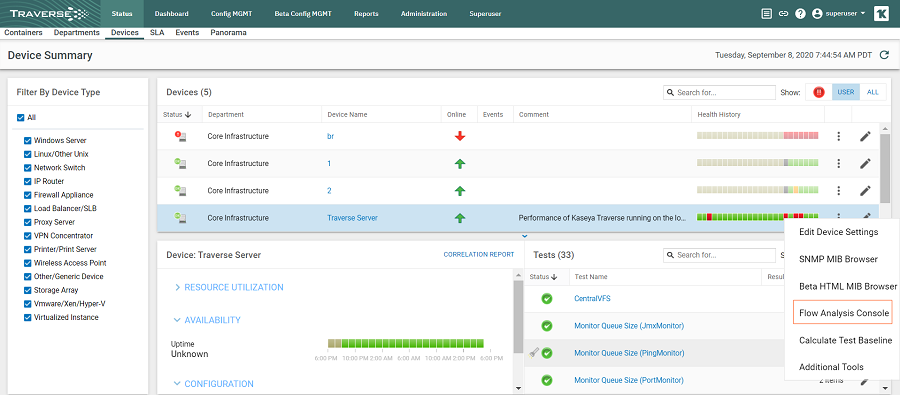
Click the Flow Analysis Console option for a selected network device or switch on the Status > Devices > Device Summary page.
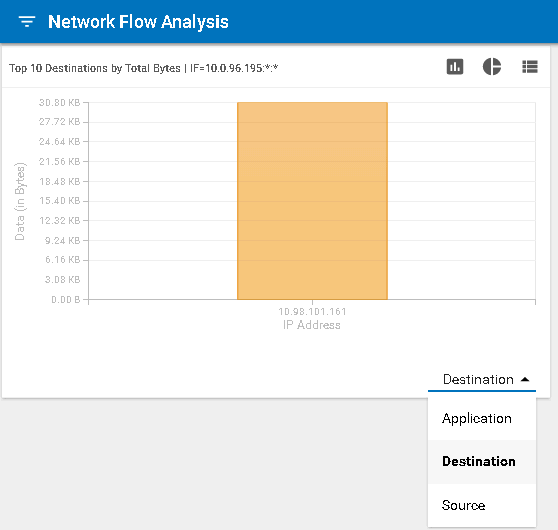
Each chart in the network flow analysis console has a title bar that states which devices (and optionally, which application) are being examined. There are three roles, each represented by an IP address.
The network flow analysis is always presented from the point of view of the selected device, which may be acting as either source or destination in different contexts. Remember that whether a device is considered the source or destination depends on the direction of flow of packet data on a given port at a given time.
Each chart can be displayed as a table, a pie chart, or a bar chart.