The Topology Map is an interactive map that displays information about networks, devices within a network, types of devices, device status and how they are connected. All connections between devices are determined by data collected using the SNMP protocol.
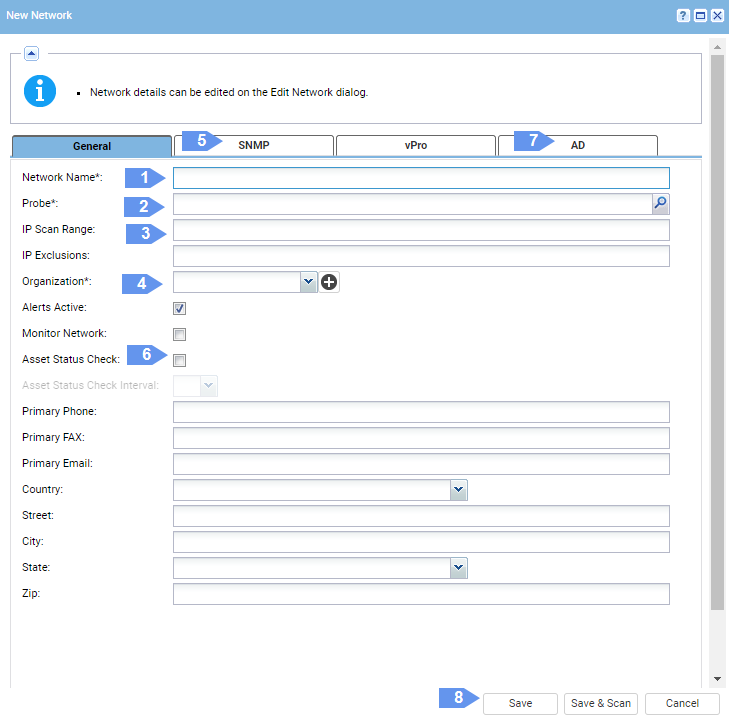
To enable the ability to interact with the topology map, navigate to Discovery > Networks > by Network, and create (or edit) a network using the steps below:
Provide a name for the network.
Select the agent machine to use for scanning with this network.
Specify the range of IP addresses to be included in the network scan.
Assign an organization to a network.
SNMP tab - enable SNMP and provide SNMP community string to establish connectivity on the map. Note: for topology to be properly created, SNMP must be enabled for all network devices (and printers) and a common SNMP community string must be used for all SNMP-enabled devices.
(Optional) Select Asset Status Check and specify Asset Status Check Interval in order to check automatically if the asset is online or offline.
(Optional) AD tab – put credentials in order to connect to your active directory. Note: providing Active Directory credentials will enhance the accuracy of the network topology visualization.
Make sure that all necessary fields are filled and click Save.
In order to see the topology map of the network, preform a scan of the network. If you are creating a new network, click Save & Scan, or select network from grid on By Network page and click Scan Now. It will take some time for VSA to gather information about all the devices within the network, and the topology map will be displayed in Topology Map tab as a result of the network scan.
Note: If you have networks, that were set up before, please, check their settings (related to steps 1-9 documented above) and re-run a scan to enable the Topology Map.
Topology Map View
Topology map has two variants of view: cluster and tree. You can switch from one to the other view clicking on Cluster View/Tree View button in the bottom right.
In the bottom of the map there is time and date of last network scan.
Devices displayed on the map are equivalent to those that are displayed in Discovery > Networks > Discovered Devices tab.
There may be 2 hubs displayed on the topology map. One hub contains the current network devices and the second, historical data. Once discovered, a device will always be displayed even if it is not found during the next scans.
Relationships between devices and their connection gateway/access points will be shown on networks where SNMP is enabled with valid community string. Otherwise devices will be connected to a "hub" node for each network.
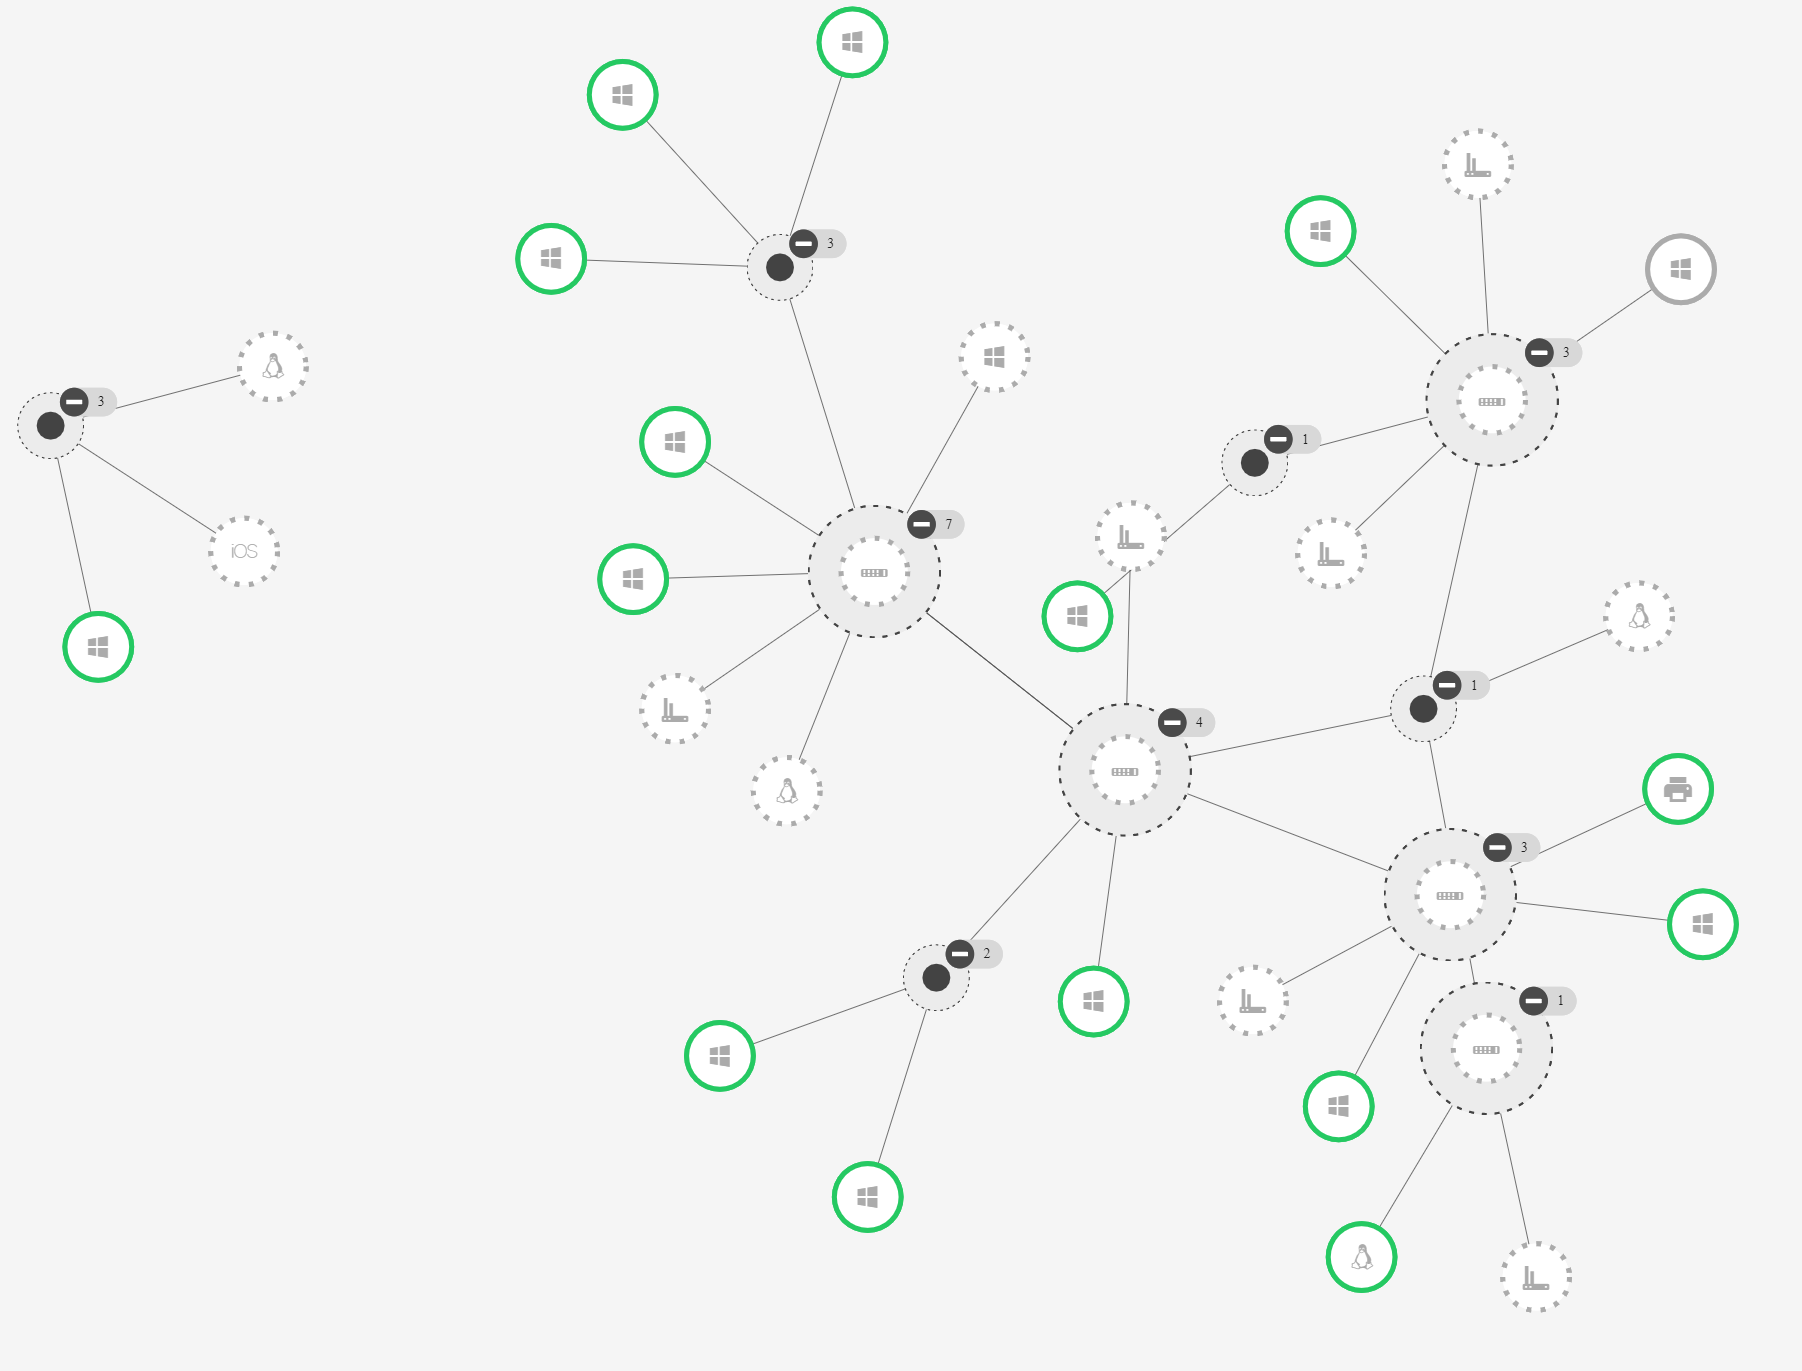
Cluster View
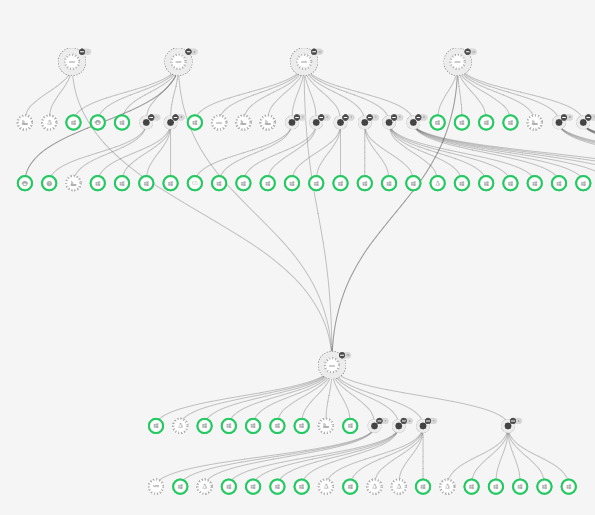
Tree View
Collapse All/Expand All- collapse or expand topology map nodes using this button in the bottom right.
Zoom In/Zoom Out - change the size of the topology map using these buttons on the right.
Collapse one unit and hide devices.
Expand one unit and show devices.
Alarm Summary badge - alarm counts on agent and non-agent devices that currently have open alarms. Clicking on it, user is redirected to Alarm Summary page, filtered specifically for the selected node.
Filter
Use filters on the top of the topology map to highlight specific nodes and for quick navigation on the map.
Filters:
Network - The displayed topology is in the context of an individual network scan.
Machine Group - Select or enter machine group ID, and map will display devices which have the selected machine group ID.
Name - Enter or select the name of the device to show it on the map.
Type - Select or enter device type that you want to highlight on the map.
IP Address - Select or enter the IP address. Map will display those units, that have this IP address.
MAC Address - Select or enter the MAC address of device that you want to display on the map.
Device Status
Statuses of the devices are marked as circles of different colors around units. Devices have the following statuses:
Status
Definition
Device is online, can be an asset or an agent.
Device is offline.
Status is unknown and the device is neither an asset nor an agent.
Device Details
To view details about a specific device, click on the unit circle. The information about the device will be displayed in Quick View window.
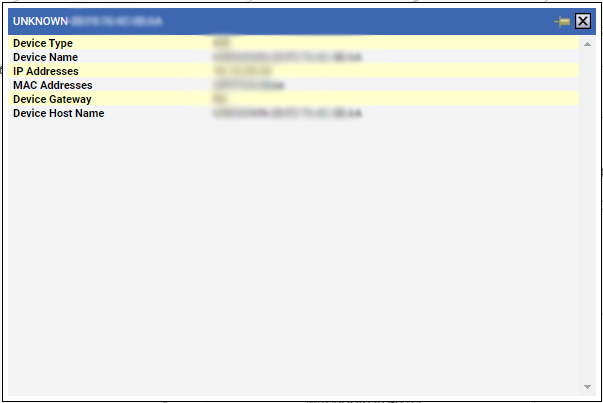
Device Quick View window - Shows information about the device, that is not an asset and not an agent.
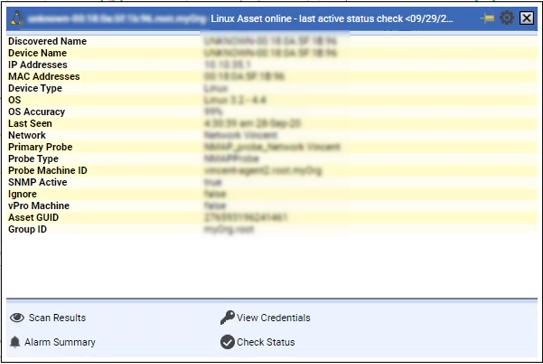
Asset Quick View window - Shows information about the asset.
Scan Results - Displays the latest scan results for a network.
View Credentials - View credentials of this asset.
Check Status - Manually check status of the asset.
Alarm Summary - Redirects to the Alarm Summary page, filtered specifically for the selected asset.
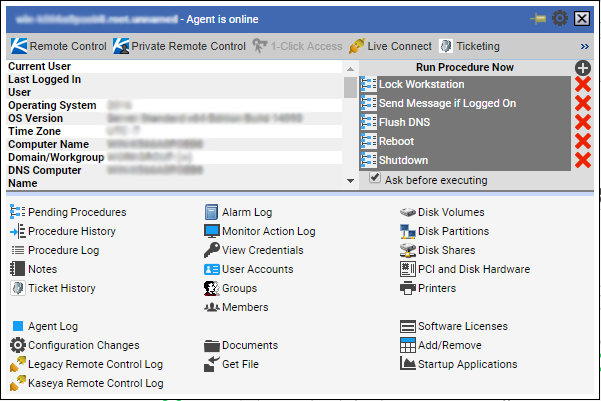
Agent Quick View window - Shows agent Quick View with information about the agent.