![]()
![]()
![]()
|
|
|
|
The Device Inspector Panel of the Devices page is a an expandable/collapsible panel that displays the properties and status of a single device selected from the Explorer Grid. The Device Panel has three sections: a Device Header section, a Device Details section and the Device Inspector section.
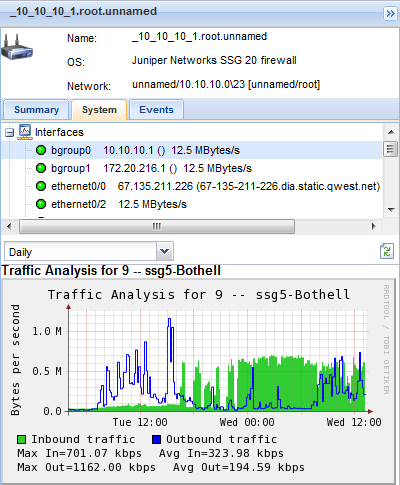
Device Header
The Header section of the Device Panel the main identifiers for the selected device.
/24—representing the network portion of the IP address.Device Details
The Details section of the Device Panel displays properties and other types of information about the device.
Device Inspector
The Device Inspector section of the Device Panel displays an analysis chart of the latest performance data for a component selected in the System tab of the Device Details section. The analysis chart can display performance data for different, selectable time periods: day, week, month and year. Inbound is plotted in green. Outbound is plotted in blue.
Device Inspector data for a device is stored on the managed machine acting as the collector. As long as the collector itself is actively checking into the the VSA, performance data for the device can be inspected within Network Discovery even if the device itself is momentarily offline. When the device is online, the graphic is constantly refreshed. The data storage for each device is very small, because the Device Inspector only stores the latest "moving average" values appropriate for each time scale.
Note: - Double-clicking a device in the Explorer Grid displays a popup window of the Header, Details and Inspector panels for that device, along with controls that can be executed for that single device.