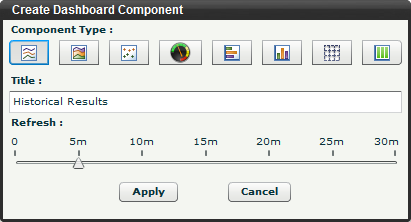
A dashboard component is created with the following properties:
Component Type: The manner in which the information will be presented, chosen from a set of built-in chart and graph types.
Title: The descriptive title of the component.
Refresh: The interval at which the component will refresh the information it contains, ranging from 0 to 30 minutes.
Dashboard Component Properties
You can choose from the following set of component types:
Line Chart: Performance history for one or more tests of the same category for the last 24 hours.
Area Chart: Similar to line chart but with stacked/overlaid area charts.
Strip Chart: Similar to line chart but with individual charts packed within a component.
Gauge: Displays a dial with current polled result and status.
Bar Chart: Horizontal bars represent current polled values for top-N or a specific set of devices, containers, or tests.
Column Chart: Vertical version of bar chart.
Table: Displays current status for top-N or a specific set of devices, containers, or tests.
Container Health: Displays the aggregate status of a container over the past 24 hours. Each hour is represented by a colored square that reports the time and severity status when you hover over it. Multiple container tiles can be displayed in one container health component, and each can be configured with a custom logo; just double-click the logo to choose from the many company and application logos bundled with Traverse. You can also add your own images by placing .jpg, .gif, or .png files in the <TRAVERSE_HOME>/plugin/web/images/container-logos/ directory. For the best effect, images should be 200x200 pixels with a transparent background.