Click the Dashboards menu to display the default dashboard.
Dashboards provide real-time, top-level views of all critical issues, services and infrastructure. Whereas service containers let you group tests and devices according to business-oriented views, the dashboards provide a more abstract way to organize information. For example, you might create a dashboard to monitor bandwidth across your entire network, or a dashboard that reports which devices are the top resource hogs.
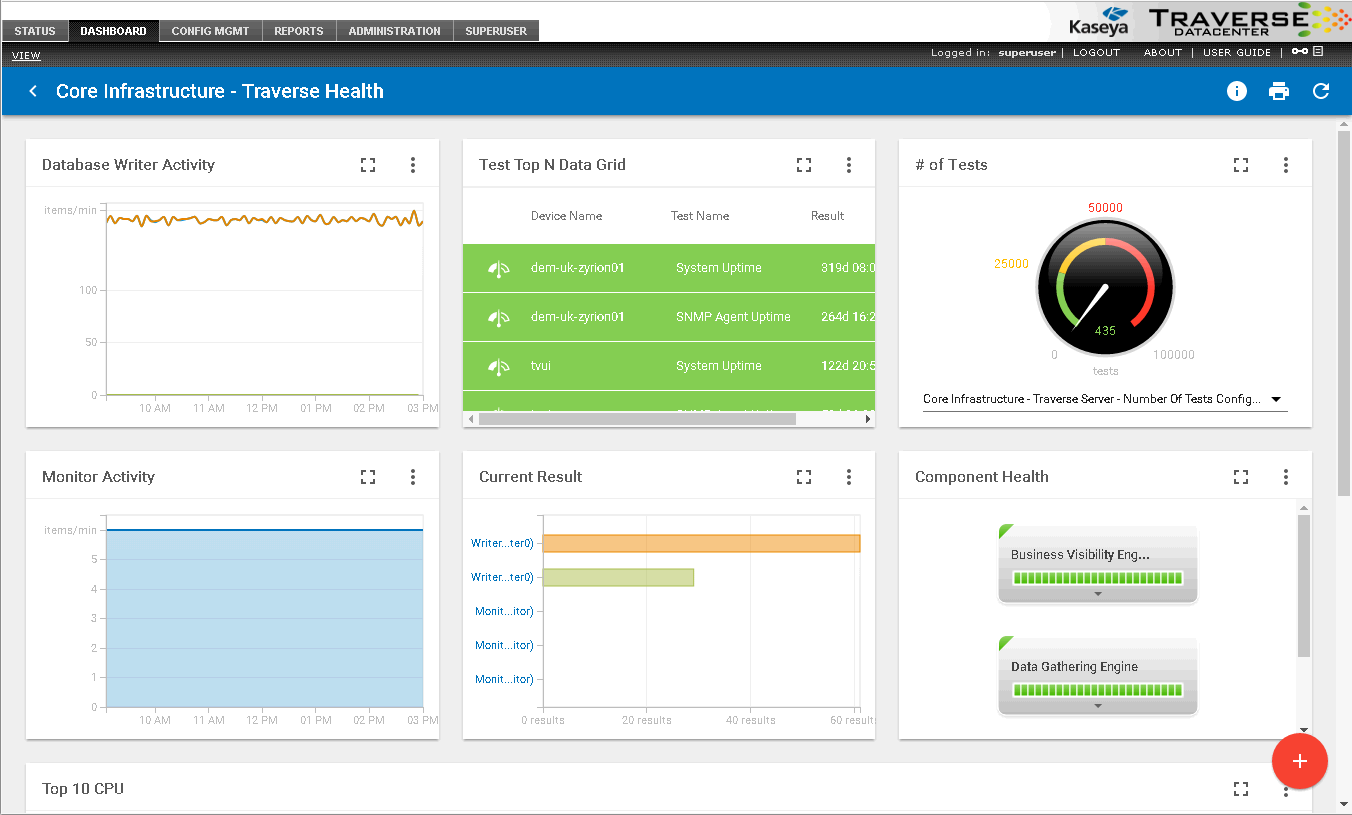
You can create multiple dashboards, each containing up to twenty components that can display and chart any metrics selected, and update in real time.
In some types of components, you can click through to view the test details for reported tests or test summary for devices.
By default, a dashboard is visible only to the user who created it, but you can mark a dashboard as "Public" to give other users in the department a read-only view of it.
You can drag and drop your dashboard components to arrange them in the dashboard.