![]()
![]()
![]()
|
|
|
|
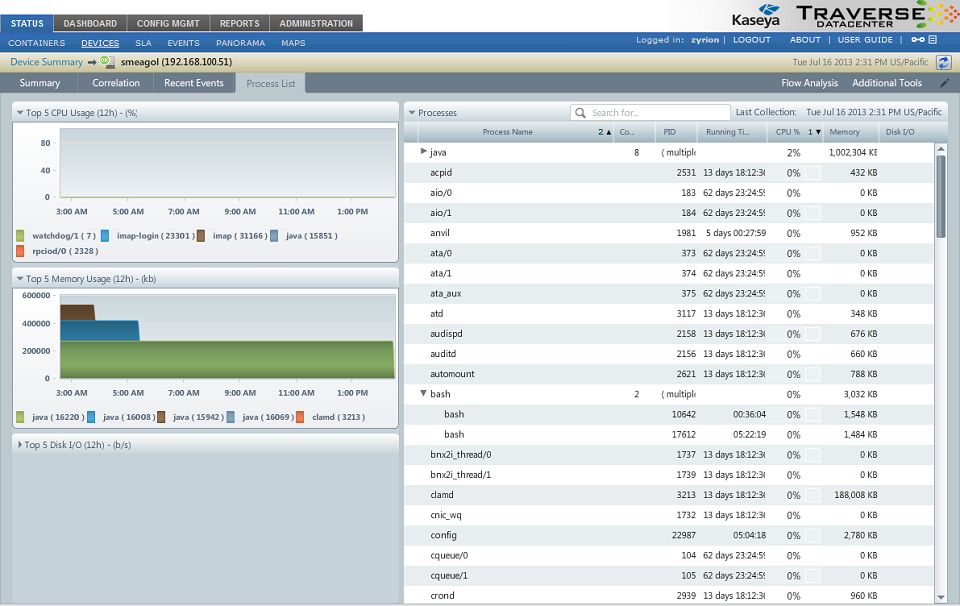
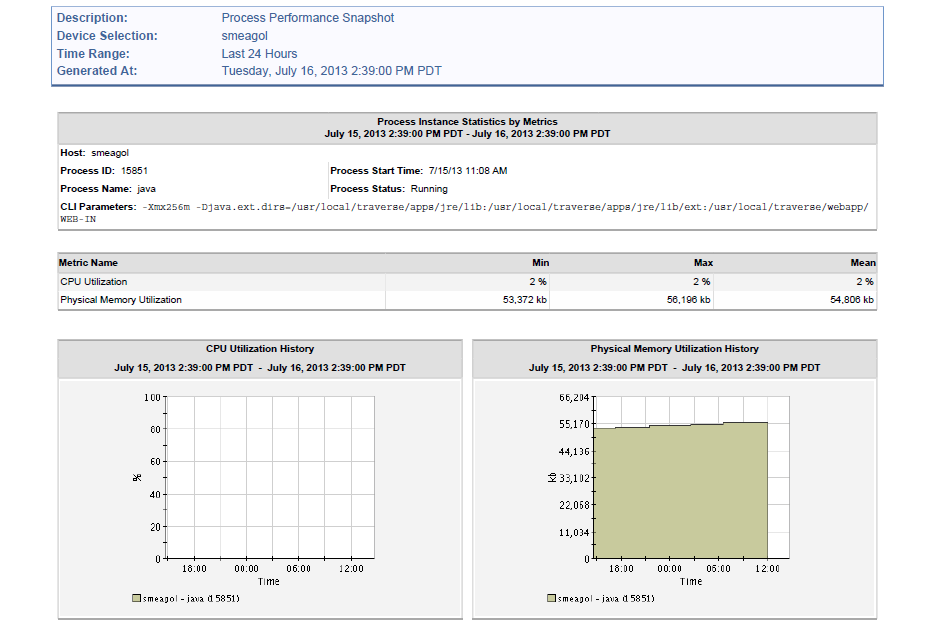
The Process Monitor for servers collects performance metrics such as CPU, disk I/O, memory, etc. of all processes on servers running Windows, Linux, Unix and other platforms. Currently, the following methods are supported for retrieving process data:
Note: The Process Monitor only collects performance metrics and displays and reports on that data. Alert thresholds and notifications cannot currently be set using Process Monitor.
Enabling the Process Monitor
Edit the device you wish to enable process monitoring on, and select the Enable Process Collection checkbox. You will need to select the monitor type appropriate for your host, and you will be able to use any existing credentials, or create a new set of credentials.
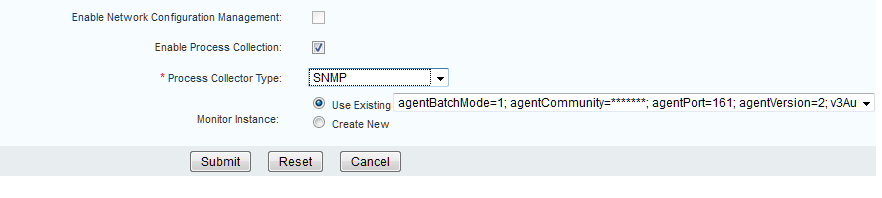
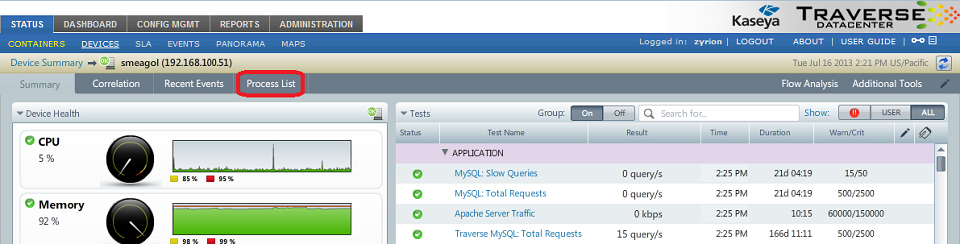
Note: You will need to reload the Device Summary screen once you have made this change, for the Process List entry to become available.
Using the Process Monitor
At this time, Traverse only supports this data collection through SNMP, and WMI (Support for other agents such as NRPE, Munin, Zabbix, etc. is also being considered). Process collection is not available for non-server devices (routers, switches, load balancers, etc).