![]()
![]()
![]()
|
|
|
|
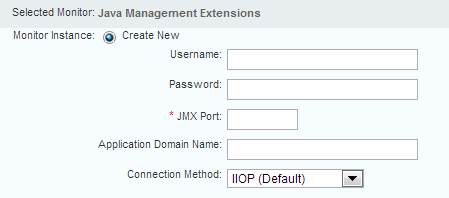
The Java Management Extension (JMX) monitor collects availability and performance metrics of Java applications, including but not limited to, ActiveMQ, Apache, BEA WebLogic, Hadoop, JBoss, Jetty, JVM, Oracle, and SwiftMQ. Similar to SNMP and WMI monitors, various applications, such as Tomcat, expose relevant metrics through the JMX monitor. See JMX Configuration for App Servers.
Note: If you have a firewall, you might need to update your firewall rules since return JMX connections from the Java application are made at randomly high TCP port numbers.
Credential/Configuration Settings
Note: JMX support is enabled by default on Traverse components, including the version of Apache Tomcat installed on the BVE. All components support the IIOP protocol and use the following TCP ports:
Test Parameters
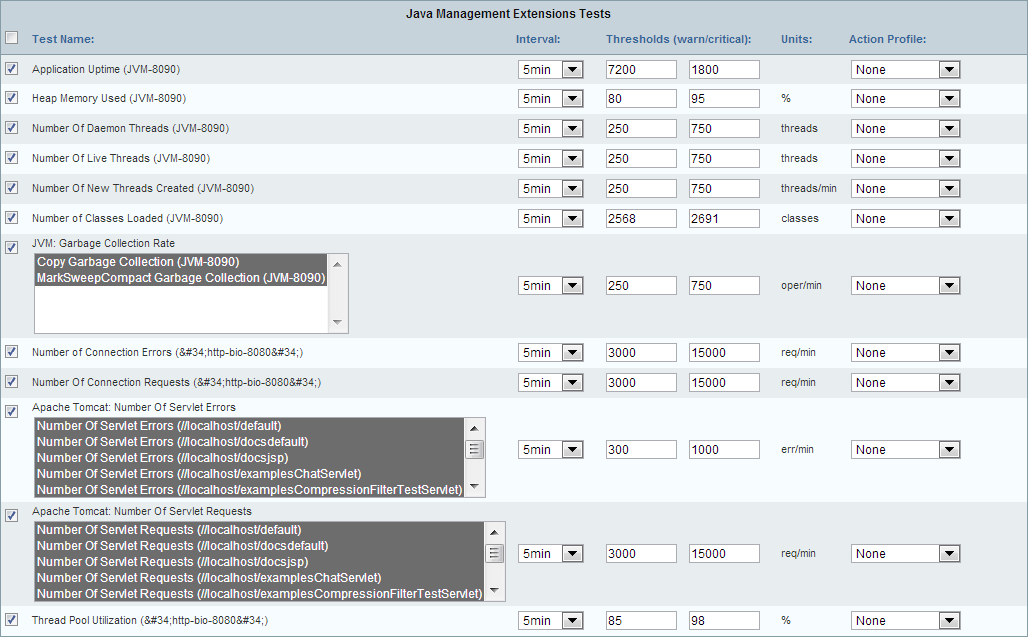
Field |
Description |
Test Name |
Enter/modify the name of the test. |
Interval |
Use the drop-down menu to specify the interval at which Traverse executes the test. |
Thresholds (warn/critical) |
Enter/modify the threshold levels that cause the test to change to (a state of) Warning or Critical, respectively. |
Action Profile |
Use the drop-down menu to select an action profile for the test. See Administrator Configured Action Profiles and Thresholds for more information. |