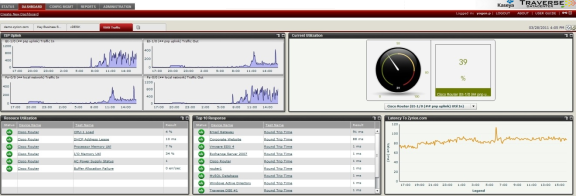
The customizable RealView dashboard feature lets you create custom dashboards to view the performance of services and infrastructure. You can create multiple dashboards, each containing dashboard components related to a particular area of service you want to monitor.
Navigate to Dashboard > Create New Dashboard.
Enter a name for your dashboard and choose whether you want it to be visible to other users or private, and then click OK.
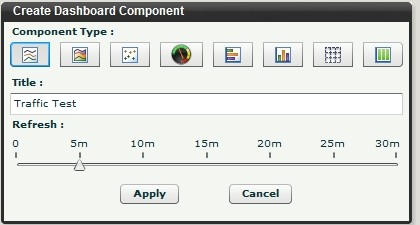
Click Create New Chart/Table in your new empty dashboard to open the Create Dashboard Component dialog.
In this example, you are creating a line chart component for traffic tests. Select the line chart component type icon, fill in the Title field, select the refresh interval, and then click Apply.
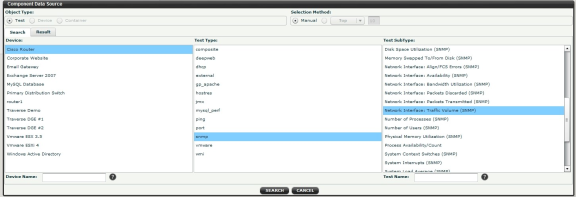
Now specify the data source for the component. Select the devices and test types, and then click Search to find the matching tests. Select the tests you want the component to use by dragging and dropping them from the Matching Tests list to the Selected Tests list, and then click Apply.
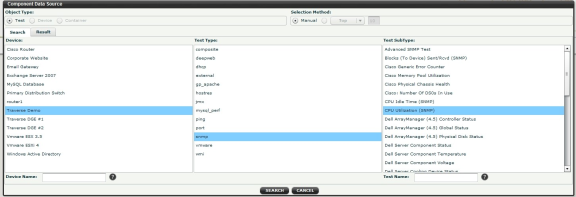
Now add a gauge component for a CPU utilization test. Click the '+' Add Dashboard Component icon in the upper right corner of the dashboard, select the gauge component type icon, fill in the Title field, select the refresh interval, and then click Apply.
Now specify the data source for the component. Select a device, and then click Search to find the matching tests. Drag and drop the CPU load tests to the Selected Tests list, and then click Apply.