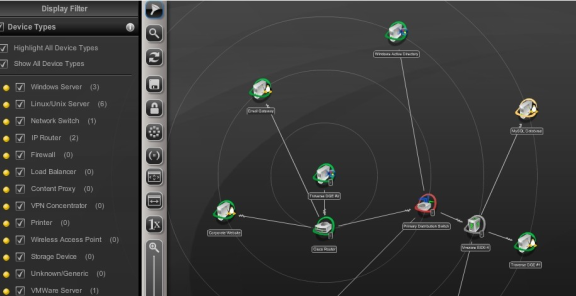
The Panorama feature offers an interactive graphical representation of the devices in your network that are being monitored, including the status of the devices and the dependency relationships between them. Panorama offers three different topology layouts, flexible display filters, pan and zoom functionality, the ability to configure and save custom views, and the ability to add or remove device dependencies.
Navigate to Status > Panorama.
Click on the Display Filter icon on the top left hand corner to view various filtering and layout options.
Choose between hierarchical (the default), circular, or grid layout options.
In edit mode, you can move the position of the nodes on the canvas. You can also add or remove device dependencies. When you click on a device node, a plus sign appears on the icon; click this plus sign and drag to another device to create a new parent/child dependency relationship. When you click on the line connecting two devices, a red X icon appears. Click this X to remove the device dependency.
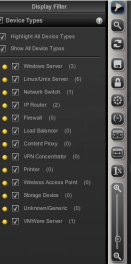
You can filter the devices shown in the topology view by type or status. By default, the Filter By Device Type & Status frame opens with the Device Types pane expanded. If you click on the Status bar, the Status pane expands instead. You can also click on the highlight option for each device or state, and device nodes of that type or state will appear highlighted in the topology view.
You can choose to collapse nodes based on depth in the hierarchy or threshold number of child nodes. If you select the Leaf Nodes Only check box, only the leaf nodes will be collapsed.
After customizing the topology view, you can save it as a custom layout.
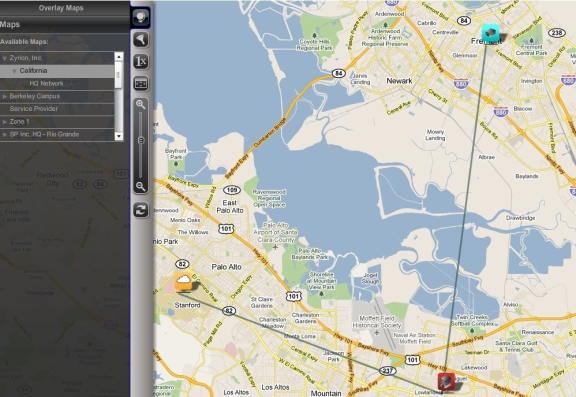
You can Navigate to Status > Maps to view network on a geographical overlay.