The SLA Manager lets you track compliance against user-defined service level agreement metrics for containers, devices and tests. These SLA metrics are calculated and displayed on a real-time dashboard that displays the amount of time that the metric is within the SLA threshold and also displays how close the metric is to violating the SLA requirement.
Navigate to Administration > SLA.
On the Configure SLA Manager page, click Create an SLA Measurement.
Fill out the fields in the Create an SLA Measurement form:
SLA Measurement Name
Comments/Description: An optional field that lets you provide some additional descriptive information that will appear in the SLA Manager list of SLA measurements.
Calculation Period
Calculation Frequency
Threshold: The percentage of the Calculation Period that the metric must be in the OK state.
Schedule: Used to specify business hours and weekdays for calculation of the SLA period.
Select whether the SLA is being created for a Container, Device or Test
If you selected Container or Device, then via the drop-down list, select the specific Container or Device for which the SLA is being created, and then click Submit.
If you selected Test, then click Submit to go to the page for selecting the underlying device tests for this SLA metric, and then click Add.
Choose a parameter you want to search with, then a value, and then click Add to use this as a search criterion. Add as many other search criteria as you need, and then click Apply to run the search.
In the Search Results pane, select the tests that you want to be a part of the SLA metric for each device, and then click Assign to SLA Measurement.
You can now click on the devices you've added in the Assigned Devices list, and the tests you selected will appear under Assigned Tests.
Use the Add, Edit, and Remove buttons to make any further changes to the devices and tests you want to include.
Click Done to finish creating the SLA measurement.
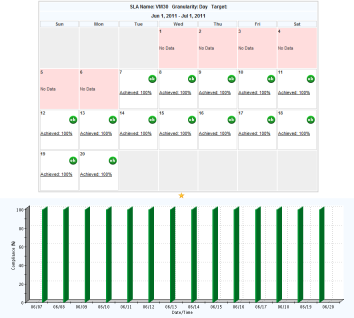
Navigate to Status > SLA to view real-time data for your SLA metrics on the SLA Manager dashboard.