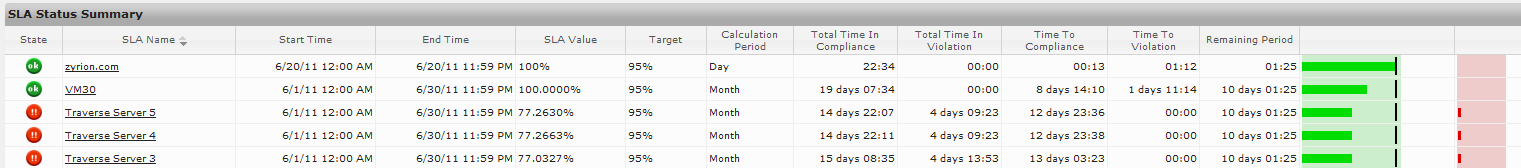
The SLA Manager dashboard can be accessed by navigating to Status > SLA. The SLA Status Summary view table provides the key details for all the defined SLA metrics in the system. Each row in the table represents key information for a single SLA metric, including the following:
Quick-glance current status icon - The upper left corner of the box shows the icon for compliance or the icon for violation.
Time to Compliance - This is the amount of time left in the SLA calculation period during which the metric must be normal for SLA compliance to be reached.
Total Time in Compliance - This is the amount of time in the SLA calculation period during which the metric has been normal, i.e. in a state contributing towards the compliance calculation.
Time to Violation - If the SLA metric is in a critical state for this amount of time before the end of the SLA calculation period, the SLA will be violated. If the column shows 00:00, then that is because the SLA has already been violated.
Total Time in Violation - This is the amount of time in the SLA calculation period during which the metric has been in a critical condition, i.e. in a state that is contributing to the non-compliance calculation.
Calculation period status bar - The calculation period is represented as a status bar in the rightmost columns, along with the threshold.
As time passes, the amount of time the SLA metric is normal fills the green section in a brighter green, and the amount of time the metric is critical fills the red section in a brighter red. At the end of the calculation period, the pale green with have either crossed the black line to indicate compliance, or will end before the black line indicating violation of the SLA.
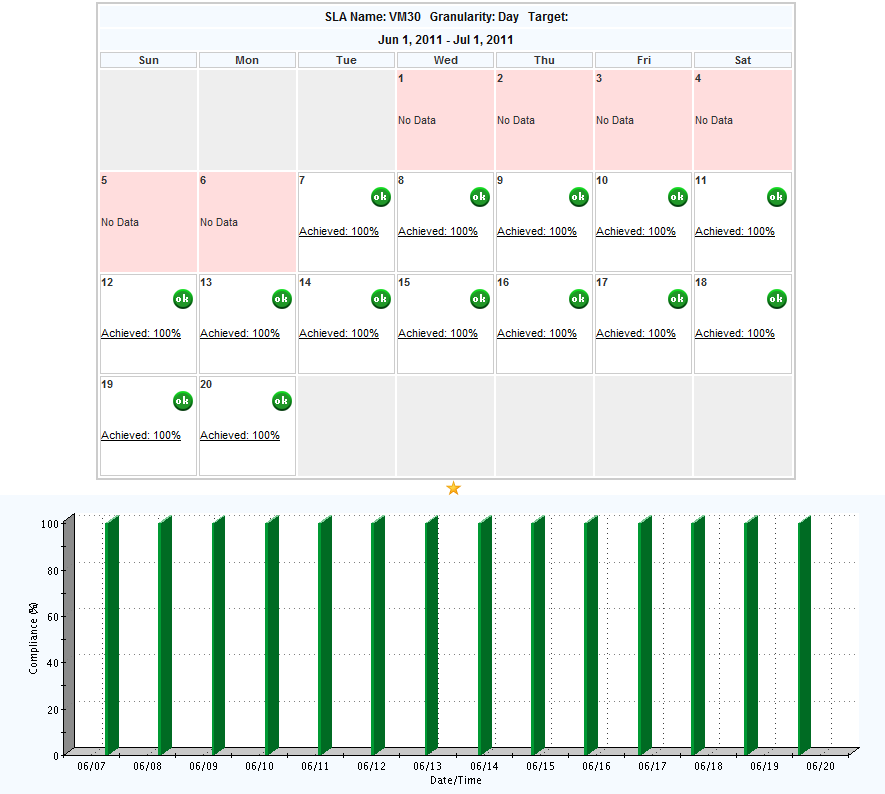
You can also click on each SLA metric name to see a more detailed history table that shows the exact time periods and percentages achieved for each calculation period. The granularity of drill-down that is available is based in the granularity defined when the SLA metric was created.
 icon for compliance or the
  icon for violation.