Microsoft SQL server monitor
Monitor description
This monitor type is capable of monitoring several key aspects of a Microsoft SQL Server database. The monitor uses the native SQL Server interface and does not require an ODBC driver installed on the Network Monitor host machine.
- System type: Windows
- Category: Database

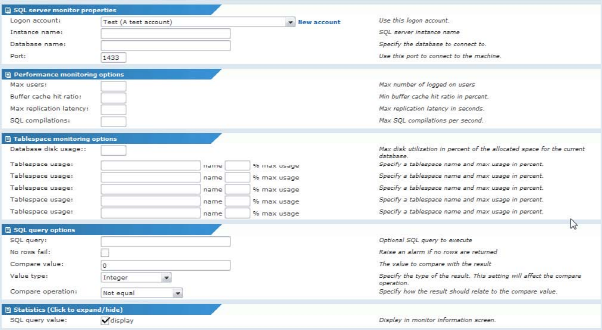
SQL server monitor properties
Monitor specific properties
These fields are required to connect to the database to perform configured tests.
- Logon account - The logon account contains the credentials to use when authenticating with the SQL Server database.
- Instance name - The SQL server instance name to use.
- Database name - Name of database to connect to.
- Port - The port number the database server listens to. Defaults to port
1433.
Performance monitoring options
- Max users - Maximum number of allowed users logged on at the same time. Leave the field blank to not perform this test.
- Buffer cache hit ratio - The buffer cache hit ratio indicates the percent of the total number of requests that have been served without accessing the disk. A higher value translates into better database performance. Set this value to the lowest acceptable value. If the ratio falls below this value the monitor fails the test. Leave the field blank to not perform this test.
- Max replication latency - A value in seconds that is the maximum difference in time between master and slave. If this time is exceeded the monitor fails the test. Leave the field blank to not perform this test.
- SQL compilations - A numeric value that is the maximum number of SQL compilations that can occur per second. If this value is exceeded the monitor fails the test. A high value of SQL compilations per second can result in high CPU usage. Leave the field blank to not perform this test.
- Failed logons - A numeric value that represents the maximum number of allowed failed logons during a day. Auditing must be enabled to run this test. Leave the field blank to not perform this test.
Tablespace monitoring options
Table space is associated with physical files stored on disk. Each database can be associated with one or more table spaces, for the storage of tables and indexes. Monitoring tablespace usage enables you to be warned before the remaining free space in a table space passes below a threshold.
- Tablespace usage (any) - A threshold value that sets the maximum allowed usage of a table space in percent. This field applies to all table spaces in the database, subsequent fields can be used to configure exceptions from this rule for up to five other table spaces. Leave the field blank to not perform this test.
- Tablespace usage (1-5) - A threshold value for the maximum allowed usage for a specific table space. These fields override the global table space threshold. Leave the field blank to not perform this test.
SQL query option
An optional SQL statement can be executed and its output compared to a predefined value using a compare operation.
- SQL query - Optional SQL query to perform.
- No rows fail - Check this option to make the monitor fail the test if the query returns no rows.
- Compare value - Value to compare query result with.
- Value type - Type of value that is compared with the retrieved value from the database.
- Operation - Operation to evaluate the returned query result and the compare value, to determine if the test succeeded or failed.
Topic 8874: Send Feedback. Download a PDF of this online book from the first topic in the table of contents. Print this topic.