|
|
|
|
Graphs in customized reports
For graphs added to a customized report it is necessary to specify what monitors should be graphed in the graph. This is done from the Graph information page. To open this page click the graph report item. The Graph information screen displays.

Clicking the graph report item displays the graph information screen
The graph information page
This page consists of two sections. In the upper section, generic information about the graph is displayed such as its data type, period and the relevant report. In the bottom section, all monitors that are currently included into the graph are listed.
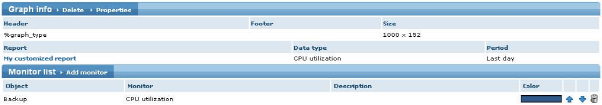
The graph information screen
Each monitor is listed together with its object, as well as the color associated with the monitor, depending on the relevant report style.
Adding and removing monitors to the graph
To add a monitor to the graph, click the Add monitor command in the monitor list section. This displays a dialog for adding monitors to the graph.
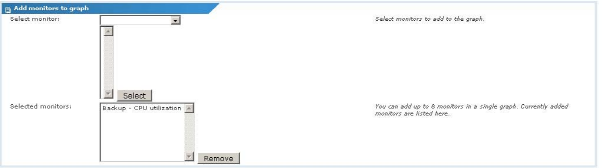
Adding individual monitors to a graph in a customized report
To add a monitor to the graph, select the relevant object from the list box, then the monitor. Notice that you are only able to select monitors relevant to the current graph. In other words, monitors not storing data of the type specified in the graph are be visible.
To remove a monitor from the graph, select it from the selected monitors list and click the Remove button.
Moving a monitors position in the graph
The order of each individual monitor in the graph is important, and corresponds to a specific color from the relevant report style to help identify the monitor. To move a report item up or down, click the up  and down
  arrow icons to move the monitor up and down respectively.
Deleting a monitor from the graph
To delete a monitor from the graph, click the  trashcan to the far right of each monitor.
Topic 9169: Send Feedback. Download a PDF of this online book from the first topic in the table of contents. Print this topic.