|
|
|
|
Data tables
The data table report item can display tabular data in both horizontal and vertical tables. This makes it possible to display readings in a textual format.
The number of rows or columns, depending on the layout, is dependent on the report time period.
You can choose to report snapshots or period averages in the data table.
- Snapshots - A snapshot is the closest data sample to the cell. For example, if you have a
Dailyreport and there are two samples at14:59and15:02, the data shown for the cell at15:00is the sample at14:59. - Period Average - The period average option averages of all samples within each period and uses that value for the respective cell.
These two powerful options provide you with good control of how to present different types of data. Snapshots are more interesting for some types of data and period averages are more interesting for others.
Object and monitor configuration
This entire section is available for Customized reports only.
The first section specifies what objects and monitors to include in the data table.
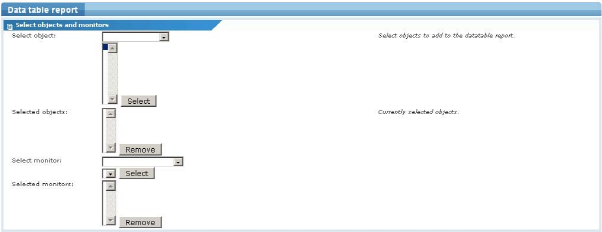
Object and monitor configuration
- Select object - Select objects to be included in the data table from the list and click the Select button. The object is added to the data table and listed in the selected objects list. To remove an object from the data table, select it and click the Remove button.
- Select monitor - In a similar way, individual monitors can be included in the data table. Select the relevant object from the list and then the monitor. Click the Select button to add the monitor to the data table. To remove a monitor from the data table, select it and click the Remove button.
Data table configurations
In this section individual data table configurations are defined.
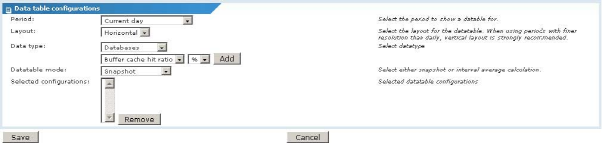
- Period - This setting is only available when editing data tables in a Customized report. Select the period to report the data.
- Layout - Select between a horizontal layout, where the time is presented as going from left to right, or a vertical layout where time is listed as going from up to down.
- Data type - Select the type of data to be put into the configuration, as well as the presentation unit desired. Click the Add button to add the configuration to the data table. To remove a configuration, select it from the list and click the Remove button.
- Data table mode - Select
SnapshotorInterval averagefor the configuration. Notice that this setting is per configuration, so it is possible to display each data table using a different data type and data table mode.
Topic 8509: Send Feedback. Download a PDF of this online book from the first topic in the table of contents. Print this topic.