|
|
|
|
Toplists
Network Monitor can calculate the min, max and average of recorded statistics data of all monitors for daily, weekly and monthly periods and present them in a toplist fashion. This data is continuously updated in real time.
Using Toplists
Network Monitor currently calculates toplists on a daily, weekly and monthly basis. This means that Network Monitor calculates the min, max and one-day average of recorded statistics data for each monitor, over those periods, and stores them in their respective toplist. To open the Toplists view to browse the toplist data, select Toplists from the Reports menu.
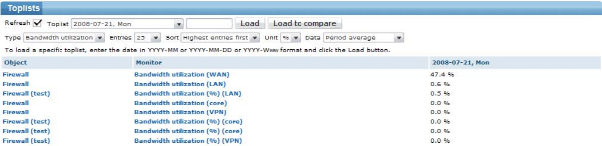
The Toplists view
- Toplist - Available toplists are selectable from the select box. After choosing the desired toplist, click the Load button and it is loaded instantly. Up to 14 daily toplists, 8 weekly and 6 monthly toplists can be selected in the Toplist box. Older toplists can be accessed by typing the date of the toplist in the following formats:
- Daily toplist -
YYYY-MM-DD - Weekly toplist -
YYYY-Wnn, wherennis the week number. The week-numbering is affected by the respective setting in the program settings. Type in the textbox next to the Load button, then click the Load button to load the desired toplist. - Monthly toplist -
YYYY-MM
- Daily toplist -
- Toplist type - To view different types of toplist data, choose the type of data in the Type select box. Once a toplist data type has been chosen Network Monitor instantly updates the toplist view. The same is true for all options in the Toplists view. When an option is altered, the view is updated immediately to reflect the settings.
- Entries/Mode - The Entries select box configures the number of monitors displayed in the list. The Mode select box determines the sort order of monitors, listing the highest or lowest value first. Use the Entries select box together with the Mode select box to configure a toplist view to show, for example, the
Top 50 highest CPU loadentries or theTop 10 machines with least amount of Free memory. The Mode box also has comparison modes to compare two toplists. See Comparing toplists below for details. - Unit - With the Unit select box the presentation unit can be selected on some toplist types such as
Free disk space,MemoryorTemperatures. - Data - The Data select box configures a toplist to display either the recorded min or max values, or a 1-day average. For some data the average is a more interesting value than the recorded extremes, but in some cases the min and max values are also very interesting, such as in the
Top 10 CPU spikesexample below.
Examples
Top 50 objects with highest average CPU load
- Type -
CPU load - Entries -
50 - Mode -
Highest entries - Data -
1-day average
Top 10 CPU spikes
- Type -
CPU load - Entries -
10 - Mode -
Highest entries - Data -
Sampled max value
10 objects with least amount of Free memory
- Type -
Free memory - Entries -
10 - Mode -
Lowest entries - Data -
1-day average
Comparing toplists
Two different toplists, of the same type, can be compared with each other. This feature is useful when monitored properties evolve over time. Is the temperature in your server hall slowly rising by the month or is your SAN running out of free space? You can use the compare feature to find out.
First, load up a toplist by selecting the toplist, or typing the date, and click the Load button. Consider this list the main toplist. Next, select a different toplist and click the Load to compare button. Consider this list the compare toplist. Network Monitor presents the two toplists as follows: the main toplist on the left, and the compare toplist is placed to the right. You can now see how the monitored properties for a particular monitor changed between the two toplists.
In addition to looking at the toplists to see changes, you can ask Network Monitor for additional statistics while comparing two toplists. The available statistics can be chosen only when a compare toplist has been loaded and they can be selected from the Mode selection box.
Top movers- Displays the monitors with values that have changed the most between the two toplistsTop climbers- Displays the monitors with values that have increased the most between the two toplistsTop fallers- Displays the monitors with values that have decreased the most between the two toplists
Example
Find out which of your servers have increased the most in CPU usage over two different months.
- Select the first month and click the Load button.
- Then select the second month and click the Load to compare button.
- Enter the following values.
- Type -
CPU load - Mode -
Top climbers - Data -
Period average
- Type -
Using toplist in reports
The Reports section fully describes how to integrate top lists into your reports.
Topic 8783: Send Feedback. Download a PDF of this online book from the first topic in the table of contents. Print this topic.