![]()
![]()
![]()
|
|
|
|
A monitor tests a specific function in an asset. Most monitors are capable of collecting various statistical data for reporting purposes. When a monitor test fails consecutively a specified number of times, the monitor enters an Alarm state and executes a set of actions.
The alert status of each monitor—along with all other active monitors—is reported all the way up the monitor tree. If you are managing hundreds or thousands of monitors, this feature can quickly help you identify the individual monitor that is failing.
Alarm Status Progression
OK Status
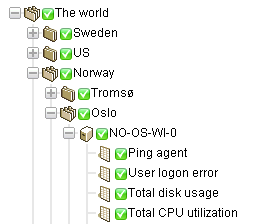
During normal operation, when a monitor is in the OK state, a green status ![]() icon displays next to the monitor in the monitor tree. Here is what the monitor tree looks like when all monitors are in the OK state.
icon displays next to the monitor in the monitor tree. Here is what the monitor tree looks like when all monitors are in the OK state.
Failed Status
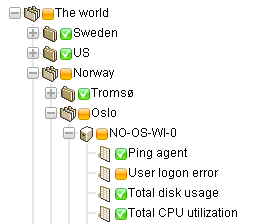
When a monitor fails its test, it changes to a Failed state, and an orange status ![]() icon displays next to the monitor in the monitor tree. The Failed status has precedence over the OK state. In this case the
icon displays next to the monitor in the monitor tree. The Failed status has precedence over the OK state. In this case the ![]() icon is reported all the way up the monitor tree.
icon is reported all the way up the monitor tree.
Alarm Status
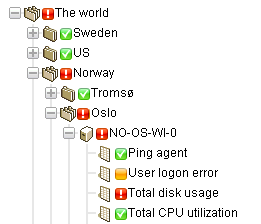
When a monitor keeps failing tests, it eventually changes to an Alarm state, and a red status ![]() icon displays next to the monitor in the monitor tree. The number of failed tests required to change a monitor to the Alarm state—known as the alarm count—is set to five for most monitors. This is the default and can be changed. Since the Alarm state has precedence over the Failed state and OK state, the
icon displays next to the monitor in the monitor tree. The number of failed tests required to change a monitor to the Alarm state—known as the alarm count—is set to five for most monitors. This is the default and can be changed. Since the Alarm state has precedence over the Failed state and OK state, the ![]() icon is reported all the way up the monitor tree.
icon is reported all the way up the monitor tree.
Disconnected Status
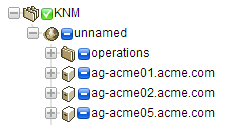
A special ![]() icon displays whenever a gateway is disconnected from the server. In this case the gateway and all lower level nodes are unable to report their data back to the server.
icon displays whenever a gateway is disconnected from the server. In this case the gateway and all lower level nodes are unable to report their data back to the server.
In This Section |