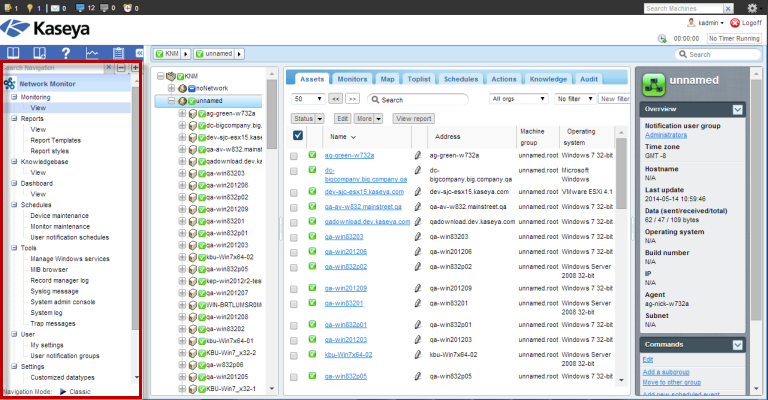
The Network Monitor navigation panel provides different views of content and enables you to configure module-level settings.
Note: The navigation panel takes the place of the "K menu" in earlier, standalone releases of Network Monitor.

These functions are detailed in the Navigation Panel Reference included with this documentation. The following is a summary description of each option in the navigation panel.
Functions |
Description |
Monitoring > View |
Selects the monitoring view. |
Reports > View |
Configures customized reports that are bound to selected sets of nodes. |
Configures report templates that can be applied to any set of nodes. |
|
Configures the overall look of reports, report templates and customized reports. |
|
Knowledgebase > View |
Selects the Knowledge base view. |
Dashboard > View |
Selects the Dashboard view. |
Configures asset maintenance schedules. |
|
Configures monitor maintenance schedules. |
|
Configures Network Monitor user work schedules. |
|
Selects the Management Windows services view. |
|
Selects the MIB browser view. |
|
Selects the Record manager log. |
|
Selects the Syslog messages view. |
|
Selects the System admin console view. |
|
Displays log entries created by the |
|
Selects the SNMP Trap messages view. |
|
Selects the Edit my settings view. |
|
Maintains user groups. Asset notifications are sent to all members of the notification user group assigned to that asset. |
|
Creates customized data types for use with monitors capable of storing generic data. |
|
Configures sets of monitors that can be applied to an asset in one step. |
|
Sets log policies for Network Monitor. |
|
Creates customized NOC (Network Operations Center) views. |
|
Specifies additional settings for alerts and other events. |
|
Sets SMS message settings. |